Check out what’s clicking on FoxBusiness.com.
Ahead of National Hot Sauce Day on Jan. 22, online grocery delivery and pickup giant, Instacart, set out to find how Americans feel about the condiment.
“One thing is certain when it comes to Americans’ food preferences — everything is better with hot sauce,” Instacart Trends Expert, Laurentia Romaniuk told FOX Business. “With more than 1,000 hot sauce products to choose from on the Instacart marketplace, customers last year purchased a whopping 444,854 gallons of their favorite fiery sauce, which goes a long way considering a typical serving size is only one teaspoon.”
Using Instacart purchase data from December 2020 through November 2021 and Harris Poll survey data of 2,025 adult Americans in December 2021, the ecommerce platform has revealed the most popular hot sauce in each state in America, along with the top 10 hot sauces in the nation.
It may be a heated debate in your household, but it’s safe to say Americans love their hot sauce with nearly three quarters of respondents using hot sauce on their food, and of that cohort, 67% saying they are passionate about their favorite brand.
BEST AND WORST STATES FOR DRIVING IN 2022: REPORT
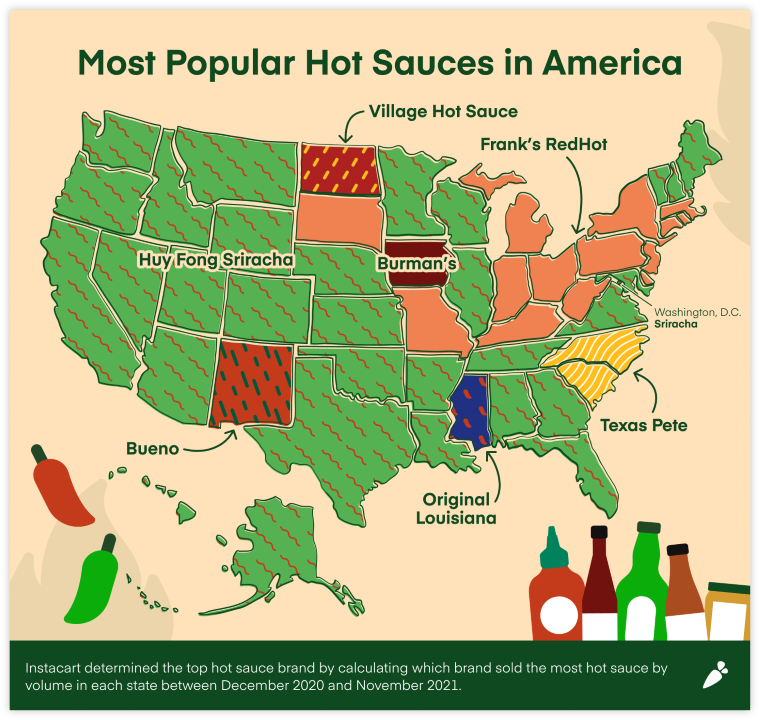
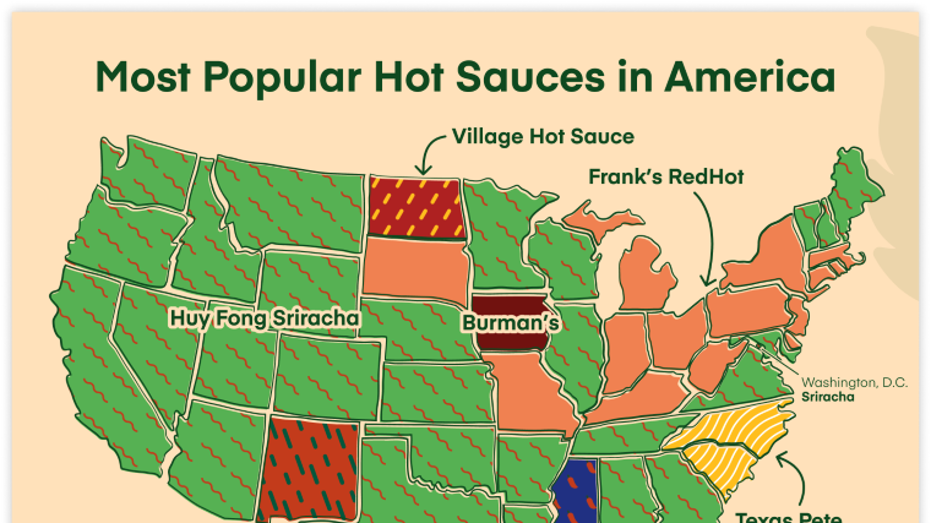
As for which hot sauce reigned supreme, Huy Fong’s Sriracha is the most purchased hot sauce across the nation and the top hot sauce in 31 states. Frank’s RedHot was trailing behind as the second most popular overall and ranked as the number one pick in 14 states, mainly in the Midwest and Northeast.
See where your home state stands below.
According to the hot sauce heat map, below, these states buy the most hot sauce. Clearly, North Dakotans like their meals spicy.
- North Dakota (5.4 ounces/customer)
- New Mexico (4.4 ounces/customer)
- Colorado (4.0 ounces/customer)
- California (3.5 ounces/customer)
- North Carolina (3.1 ounces/customer)
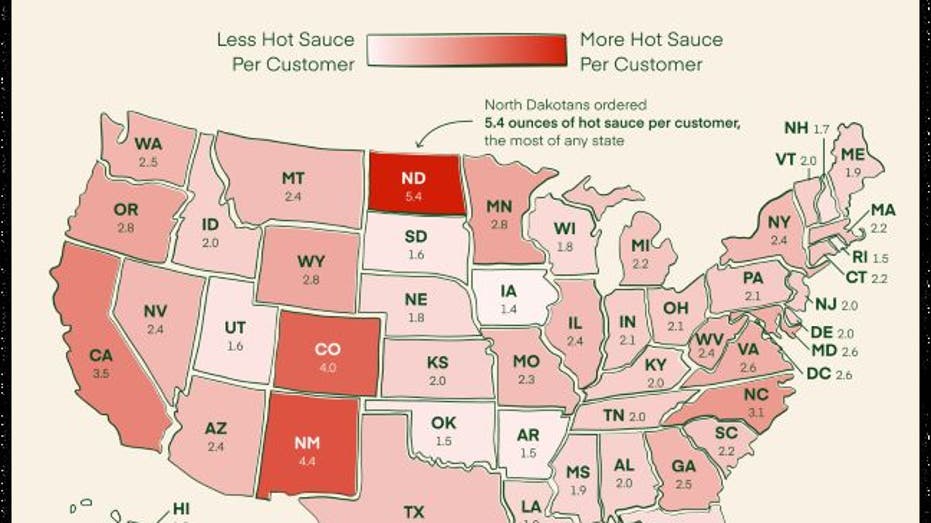
The following five states, by contrast, seem to take it easy on the heat:
- Hawaii (1.3 ounces/customer)
- Iowa (1.4 ounces/customer)
- Arkansas (1.5 ounces/customer)
- Oklahoma (1.5 ounces/customer)
- Rhode Island (1.5 ounces/customer)
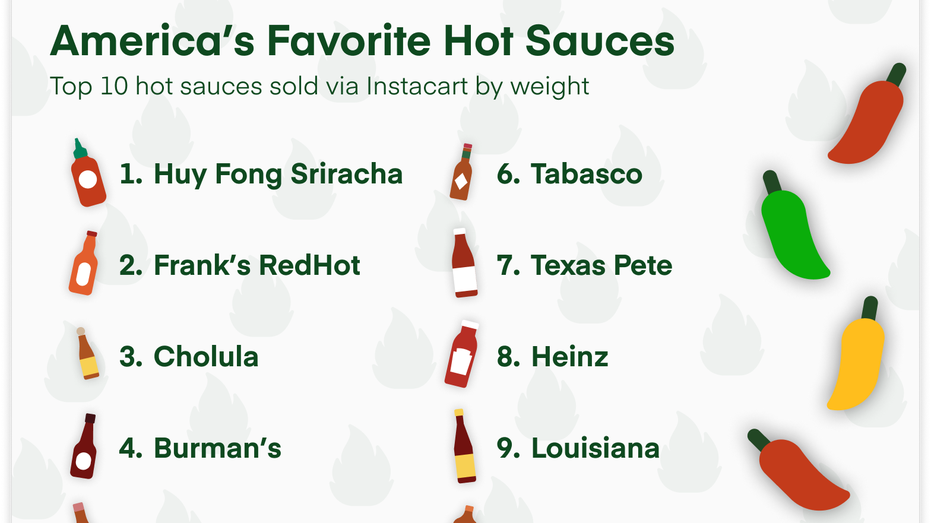
As far as the most popular hot sauces purchased overall, the infographic below show’s America’s favorite hot sauces by total delivered weight. How many have you tried?
All this hot sauce news has good timing, with February nearing and the unofficial “hot sauce season” commencing. Based on Instacart data, hot sauce purchases peak around the Super Bowl in February, with sales spiking by a high of 45% last year.
MOST POPULAR DRIVE-THRU RESTAURANT IN EVERY US STATE REVEALED
In addition, our appetite for hot sauce appears to be growing. In 2021, customers purchased 11.7% more hot sauce per customer than in 2020, and 21.6% more than in 2019.
Speaking of which, we think we’ll add a little kick to our French fry platter.