
Poorer neighborhoods are hotter than wealthier ones.
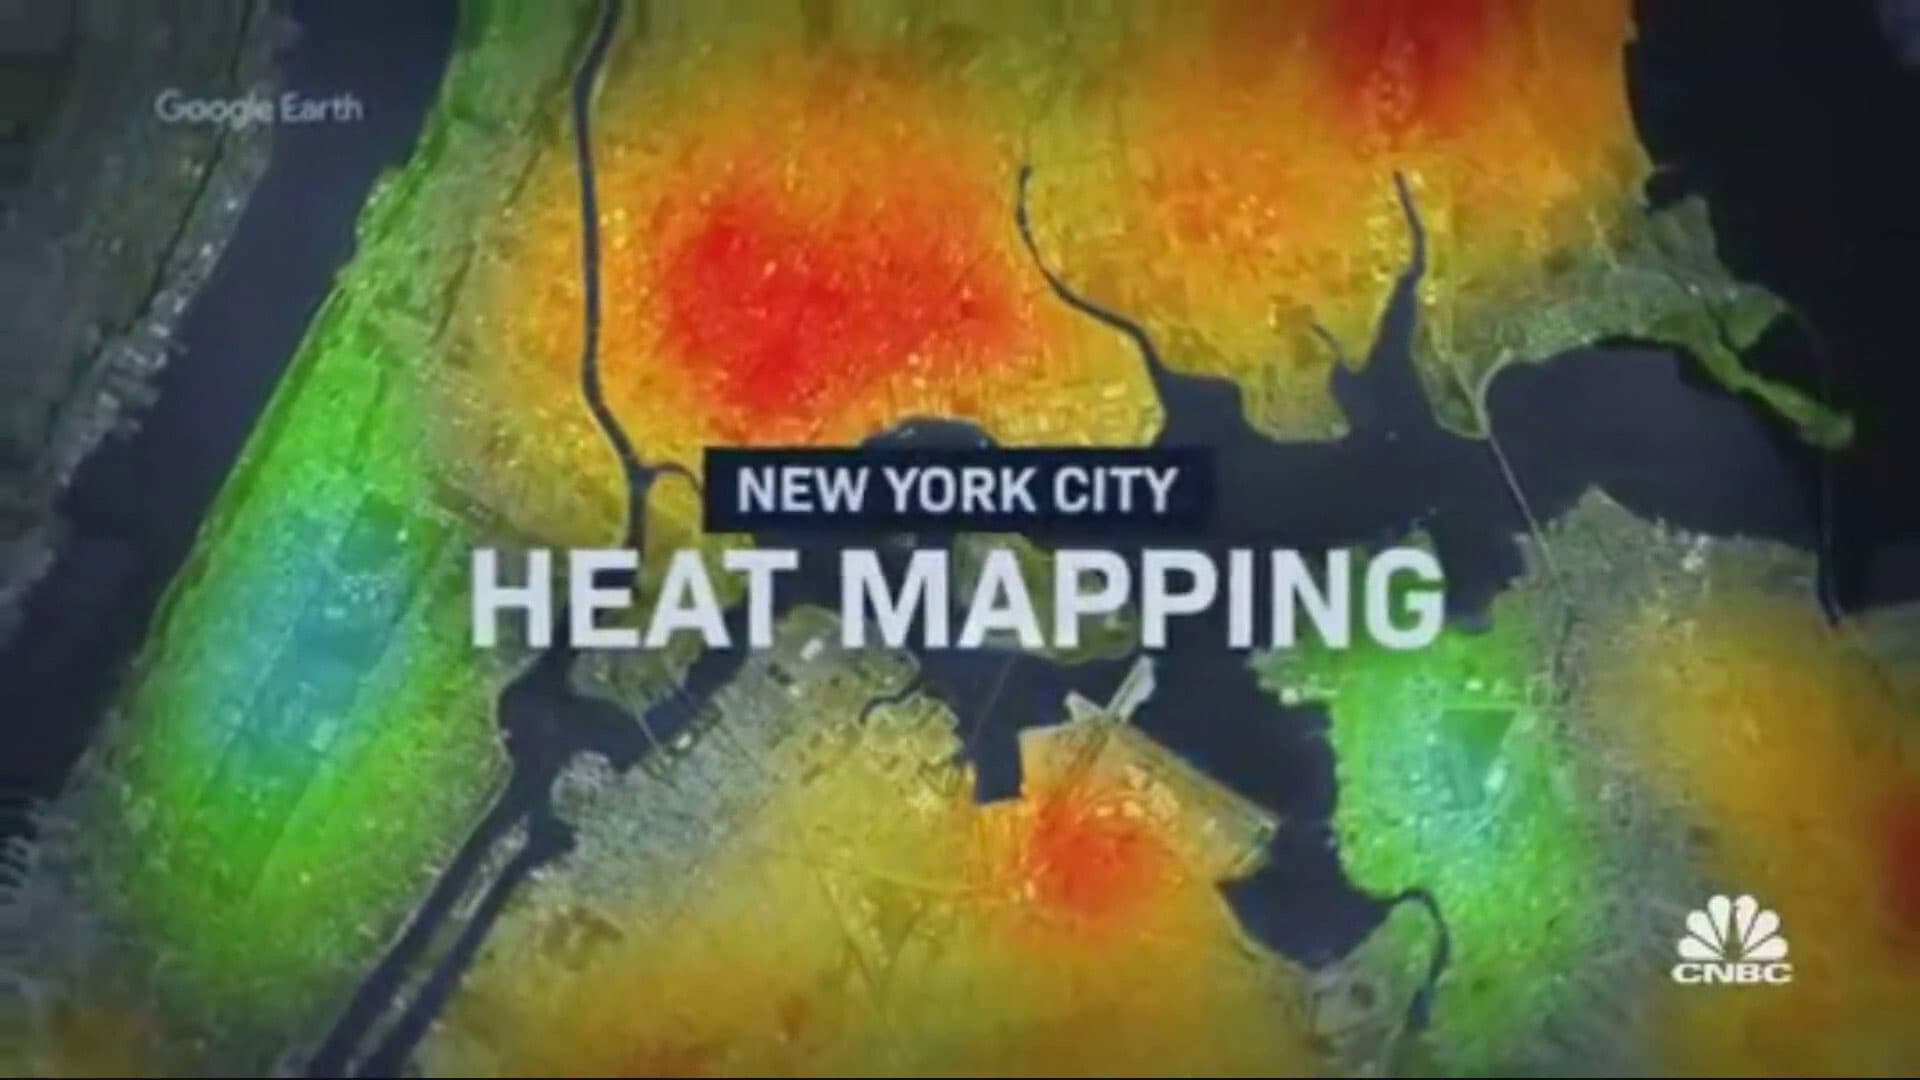
That’s the overriding finding from the New York City component of a national project to map urban heat islands. Scientists have long known that urban areas generate heat, but until now they’ve not been able to map them street by street.
On a searing summer day in New York city this past July, volunteers fanned out in cars with sensors to track heat and humidity. They traveled from the crowded tenements and truck-lined streets of the South Bronx to the open avenues of Manhattan’s upper east side.
The heat trackers told a striking story. On one afternoon in July there was at least a 7 degree difference between the South Bronx, one of the poorest neighborhoods in New York city, and the Upper East Side of Manhattan, one of the wealthiest. The difference was even wider between the South Bronx and Central Park: Nearly 10 degrees.
This kind of heat mapping is increasingly important as climate change causes global temperatures to rise and more people move to urban areas. The share of urban dwellers will grow from 55% today to 68% by 2050, according to the United Nations. In addition, as overall temperatures get hotter, the differences between the hottest and coolest areas grow larger, exacerbating divides by class and race.
“We are getting extremely granular data. Street-level data. What right now exists is satellite data where it’s New York City overall. It’s one weather station that covers a vast area, but what we did was we went out and measured temperature along local roads,” said Dr. Liv Yoon, a research scientist at Columbia University’s Earth Institute.
The data can help communities target their financial resources toward reducing temperatures by building more spaces, incorporating lighter colored rooftops, leaving more space between buildings and opening more cooling centers during heat waves.
“We want to empower the local citizen and scientists who participated so they own the data because often what we hear is they go to the authorities and they say, ‘We’re experiencing this problem, but they’re often met with, ‘You can’t just come to us with anecdotes and emotions. We need hard data,” explained Yoon.
Heat is the most dangerous natural hazard in cities
Melissa Barber, a Bronx native and founder of activist organization South Bronx Unite, has fought for everything from community gardens to redesigning the Bronx waterfront to cool the area around it. Now, working with Yoon, she is using heat mapping to make a case for change to local officials and real estate developers.
“As community members who actually fight for justice, and social justice, and environmental justice, we can now say, “There is actual data that says, ‘We breathe different air.’ There is actual data that says, ‘We see and feel heat differently than everywhere else,'” said Barber.
“Historically redlined areas certainly they have less infrastructure that is conducive to cooling. They have less green spaces,” said Yoon, who spoke to CNBC one of the very few community gardens in the South Bronx — a garden Barber helped create.
Barber says data will give her more power to change real estate development across poorer parts of New York City.
“We need to really think about how we design communities. When we talk about historical injustice, and we talk about that redlining — there weren’t parks incorporated into that planning. There wasn’t water incorporated into that planning. All of the buffers that actually allow us to experience climate differently did not exist and do not exist for many of our urban communities,” said Barber.
The temperature sensors were provided by Oregon-based CAPA strategies, a climate data and analytics firm that works with the federal government, local municipalities and non-profits.
“It’s really important because heat is one of the most insidious killers in cities. It kills more people than any other natural hazard,” said Vivek Shandas, an advisor with CAPA.
Shandas notes that climate change is upping the ante, increasing heat’s effect on local economies, which now shut down more often due to deadly heat.
“We’re seeing greater intensity of heat. We’re seeing longer durations of those heat waves, and we’re seeing more frequent heat waves come through, yet we’re still using one single number to tell us what the temperature is for a city or a region,” Shandas added.
New York is one of 12 cities participating in this year’s mapping campaign, which is in conjunction with the National Oceanic and Atmospheric Administration.
