The S&P 500 has glided to one its best starts to a year in three decades — but has just barely recovered the losses inflicted by its worst December since 1931.
The advance has been impressively broad and persistent over the past nine weeks — yet the S&P is only now challenging the level, near 2800, where rallies failed three separate times last fall.
The market has shrugged off evidence of an economic and earnings slowdown — but have investors already priced in positive outcomes on trade policy and Federal Reserve that remain uncertain?
In other words, the market has made an impressive run, right to a key proof point. The first time the S&P 500 reached 2800 was mid-January of 2018, near the end of a giddy, headlong rush higher in the wake of the new corporate-tax cut and in a rare moment of globally inclusive economic pep.
The last time the S&P closed above 2800 was Nov. 8 and the last time it touched that threshold was Dec. 3 — the day the year-end free-fall got rolling.

So with the 2019 rebound rally on apparent autopilot, here’s a check of the technical, sentiment, valuation and cross-asset gauges that could indicate whether the market is in a sturdy ascent or not as it reaches this critical altitude.
The technical conditions have been encouraging to so far. The surge off the washout lows of late December has reflected widespread participation by the vast majority of stocks. A rare “Zweig breadth thrust” — a sequence of powerfully broad daily rallies — triggered in January and many optimistic investors are leaning on its strong historical record of foretelling good returns in the following six and 12 months.
Cumulative breadth, a running daily tally of rising stocks versus decliners, has set a new record high even as the S&P 500 itself remains some 4 percent below its record high.
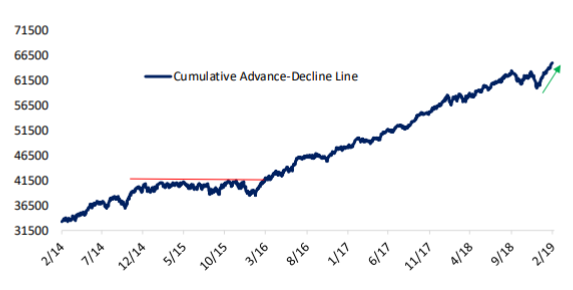
Source: Bespoke Investment Group
The climb has been so comprehensive that some short-term readings of excess are appearing.
Jeff deGraaf of Renaissance Macro Research said Friday the market was at its most overbought level since early 2018, based on the percentage of stocks now statistically stretched far above their trend. This could represent a “good overbought” condition, reflecting urgent demand for equity exposure. But even so, it tends to precede at least a slowing or flattening out of rallies for a while.
The leadership profile of the market is somewhat mixed. While aggressive, cyclically geared groups such as semiconductors have set the pace for the rally, there has also been a strong bid for steadier yield-centric sectors over the past three months. This surely has a lot to do with the refusal of Treasury yields to lift much. But it stops a bit short of a clear “risk-on” message often sent by markets at the start of a high-momentum ascent.
Investor sentiment, meantime, has been slow in turning more aggressive despite the power of the climb that has the S&P 500 up more than 11 percent so far in 2019 and already ahead of many strategists’ year-end targets.
Surveys of individual investors are right in the neutral zone. Outflows from stocks during the strong rally have been heavy and persistent — an anomaly that should count as a bullish contrarian signal. And professional investment advisors are back in the bullish camp but not in a particularly excessive way.
There is no clear edge in using the current sentiment setup for a trading call: The mood is decidedly less exuberant than in January 2018 when the S&P first traded near current levels, but professional investors are a bit more optimistic than they were last fall at the time of the thwarted fourth-quarter rallies.
Valuation is similarly situated. Here is FactSet’s chart of the forward 12-month price/earnings ratio:
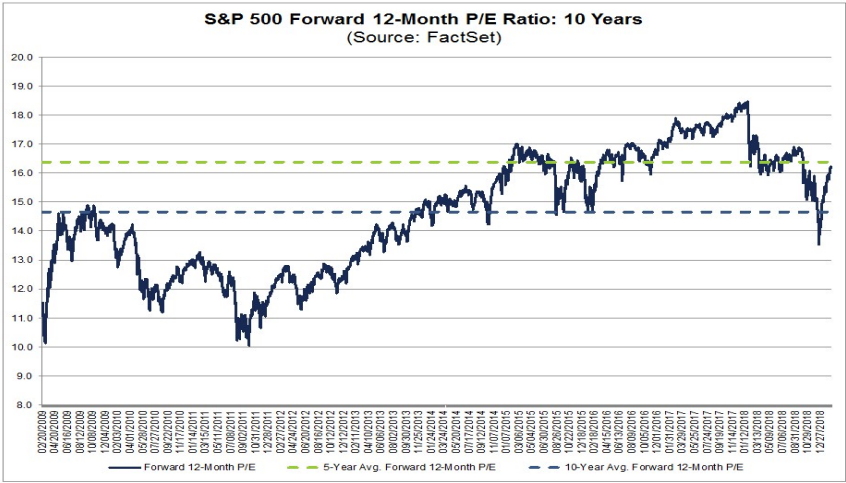
The valuation peak 13 months ago above 18-times was when the market was rushing to price in the tax-cut windfall not yet reflected in analyst’s estimates. (Note that 2018 earnings came in so far above forecasts at the time that the forward P/E at the January 2018 peak was “really” only about 17.1-times the profits actually produced by S&P 500 companies in 2018.)
That makes the current P/E above 16 look a bit less cheap, relatively, given than forecasts are now slipping and currently imply less than 5 percent growth for all of 2019 – all of it coming in the second half.
The pattern in the above chart from 2016 is worth considering. There, too, stocks were likewise recovering from a nasty “baby bear market”amid an earnings downturn, after the Fed had squeezed in a December rate hike and then turned dovishly “patient.” The P/E nosed above 16 and held there as a resumption of earnings growth came into view.
Other asset markets are generally supportive of the rally, for now. Emerging markets equities have outperformed the S&P over the past three months, a decent “tell” for global risk appetites.
Credit markets have firmed up nicely, with risk spreads between junk bonds and Treasuries receding steadily as stocks have climbed.
Tobias Levkovich, strategist at Citi, has an interesting chart showing that the December carnage in stocks was far more extreme than would be expected given modest levels of credit stress at the time.
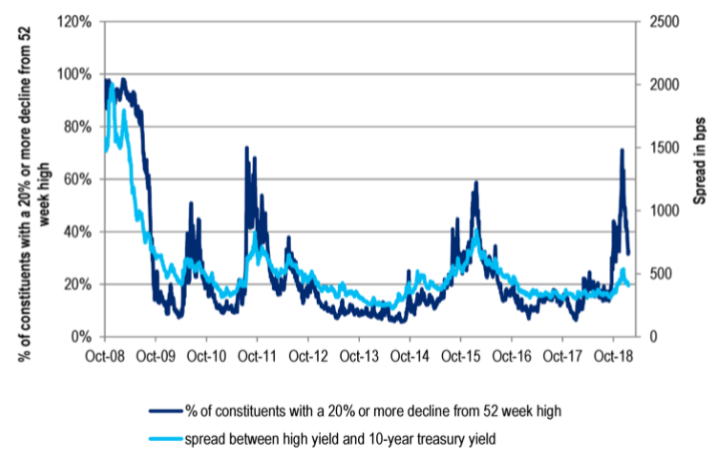
Yet high-yield spreads still remain higher now than either last January or November, when the S&P was around 2800, suggesting that credit investors need to get more confident in order for further gains in stocks to be well-supported. And the Treasury yield curve is flatter, speaking to the perceived lateness of this moment in the economic cycle.
Volatility has receded dramatically and investors seem calmed by the “subtraction of all fears” this year along the Fed, recession and trade-war fronts.
Is this setting up a “sell-the-news” moment on a trade deal or deferral, or is a fuller capitulation by market skeptics before this rally culminates?