November may be just what the Wall Street doctor ordered for our portfolio stocks after the notoriously tough month of October lived up to its reputation. The S & P 500 dropped 2.2% in October — marking the index’s first three-month losing streak since financial markets were jolted in the early days of the Covid pandemic. If history is any guide, though, stocks may be able to find their footing in November. On the first day of the new month, the major U.S. stock benchmarks posted strong gains as the Federal Reserve on Wednesday left interest rates unchanged for the second straight policy meeting. The Dow Jones Industrial Average added 222 points, or 0.67%, while the S & P 500 and the Nasdaq rose 1% and 1.6%, respectively. Since 1950, the S & P 500 has climbed an average of 1.7% in November, the best average performance for any month of the year, according to the Stock Traders Almanac. April is the S & P 500’s second-best month, with an average gain of 1.5%. December is third at 1.4%. .SPX ALL mountain The S & P 500’s long-term performance. Keep in mind that seasonal trends have their limitations and should not serve as the basis for long-term investment decisions. It’s possible current stock market considerations — such as corporate earnings, bond yields, fears of a broader Middle East conflict, and the Fed — could stand in the way of a November rally. Still, staying familiar with seasonal patterns can help contextualize near-term market moves as part of the broader “buy and homework” that Jim Cramer advises anyone who owns individual stocks to engage in on a weekly basis. As a rule of thumb, Jim says one hour of homework per week is needed for each stock in investors’ portfolios in order to keep up their holdings. Club stocks in November Following up on Wednesday’s screen of October outperformers , we analyzed our portfolio using FactSet data to see how it fared recently during the historically strongest month of November. The answer: quite well. All but two of our stocks — Salesforce (CRM) and Coterra Energy (CTRA) — have had a positive average November performance since 2013. During that stretch, which mostly coincided with the longest bull market in history, the S & P 500 overall has had an average November gain of 3.2%, and it’s been positive nine out of 10 times. The only monthly decline came in November 2021, when the S & P 500 fell 0.83%. In 2015, the broad U.S. equity index eked out a narrow gain of 0.05%. Leading the top November Club performers over the past decade are Foot Locker (FL) and Nvidia (NVDA), which have climbed an average of 9.45% and 9.39%, respectively, for the month since 2013. Foot Locker has been positive in seven of the past 10 Novembers while Nvidia has been in the green for eight of them. FL mountain 2017-12-01 Foot Locker since December 2017 To be sure, Foot Locker’s standing is influenced in large part by a 42.4% surge in November 2017, the stock’s third-best performance in any month of all time. On Nov. 17, 2017, shares of Foot Locker soared 28% following a strong-than-expected earnings report . Foot Locker also led our list of stocks that outperformed the market this October. However, shares are currently trading at $21 each — about half of what they were at the end of November 2017. We own Foot Locker as a turnaround story, though the clock is ticking . NVDA YTD mountain Nvidia YTD For its part, Nvidia has had some big November gains over the past decade. In fact, it’s registered three Novembers with at least a 20% gain — in 2022, 2021 and 2016. Its worst November since 2013 came in 2018, when it sank 22.5%. While Nvidia around $418 per share is down roughly 17% from its all-time high in August, the stock is still up around 185% year to date. Rounding out the top five November Club performers are Morgan Stanley (MS), Palo Alto Networks (PANW) and Starbucks (SBUX), with average gains in the month of 7.87%, 7.13% and 7.04%, respectively. Palo Alto has been the most volatile of the trio, with a 50-50 split between positive and negative Novembers. PANW is up nearly 75% year to date. On the other hand, Morgan Stanley has been positive in eight of the past 10 Novembers, while and Starbucks has just one negative performance. The coffee giant’s stock fell 1.9% in November 2015. For all of 2023, Morgan Stanley is down 15% and Starbucks is down nearly 8% compared to the S & P 500’s 9% year-to-date increase. Note: Our list excludes Veralto (VLTO) and GE Healthcare (GEHC) because those two companies only became public in 2023. The steadiest Club stock in November over the past decade has been Costco Wholesale (COST), which has been positive in the month every year from 2013 onward — one of just 14 stocks in the S & P 500 to accomplish the feat, according to an analysis of FactSet data. In fact, the last time shares of Costco finished a November in the red was 2008 during the financial crisis. Coterra and Salesforce are the worst-performing Club stocks over the past 10 Novembers. During that stretch, Coterra has declined on average 2.74% in the month, dragged down by three separate Novembers in which the stock fell double-digits on a percentage basis. It’s been positive in just four of the past 10 Novembers. Salesforce, meanwhile, is narrowly in the red, with an average November decline of just 0.1% since 2013. Like Palo Alto Networks, Salesforce has a 50-50 split between positive and negative Novembers over the past decade. Bottom line Past performance is no guarantee of future results. It’s a common disclaimer in the investment community that’s worth emphasizing when discussing seasonal patterns. Indeed, the negativity ruling Wall Street lately doesn’t just go away when the calendar page turns. However, our analysis of how our Club names have done in the past 10 Novembers does take into account prior trying times for investors such as the pandemic and Fed chief Jerome Powell’s October 2018 remarks indicating, at the time, more rate hikes were needed. His comments roiled the markets and led to the “Powell pivot” a few months later. We, of course, don’t make long-term decisions based on historical trends, but we watch them as part of our homework to stay on top of the market and our individual names. (See here for a full list of the stocks in Jim Cramer’s Charitable Trust.) As a subscriber to the CNBC Investing Club with Jim Cramer, you will receive a trade alert before Jim makes a trade. Jim waits 45 minutes after sending a trade alert before buying or selling a stock in his charitable trust’s portfolio. If Jim has talked about a stock on CNBC TV, he waits 72 hours after issuing the trade alert before executing the trade. THE ABOVE INVESTING CLUB INFORMATION IS SUBJECT TO OUR TERMS AND CONDITIONS AND PRIVACY POLICY , TOGETHER WITH OUR DISCLAIMER . NO FIDUCIARY OBLIGATION OR DUTY EXISTS, OR IS CREATED, BY VIRTUE OF YOUR RECEIPT OF ANY INFORMATION PROVIDED IN CONNECTION WITH THE INVESTING CLUB. NO SPECIFIC OUTCOME OR PROFIT IS GUARANTEED.
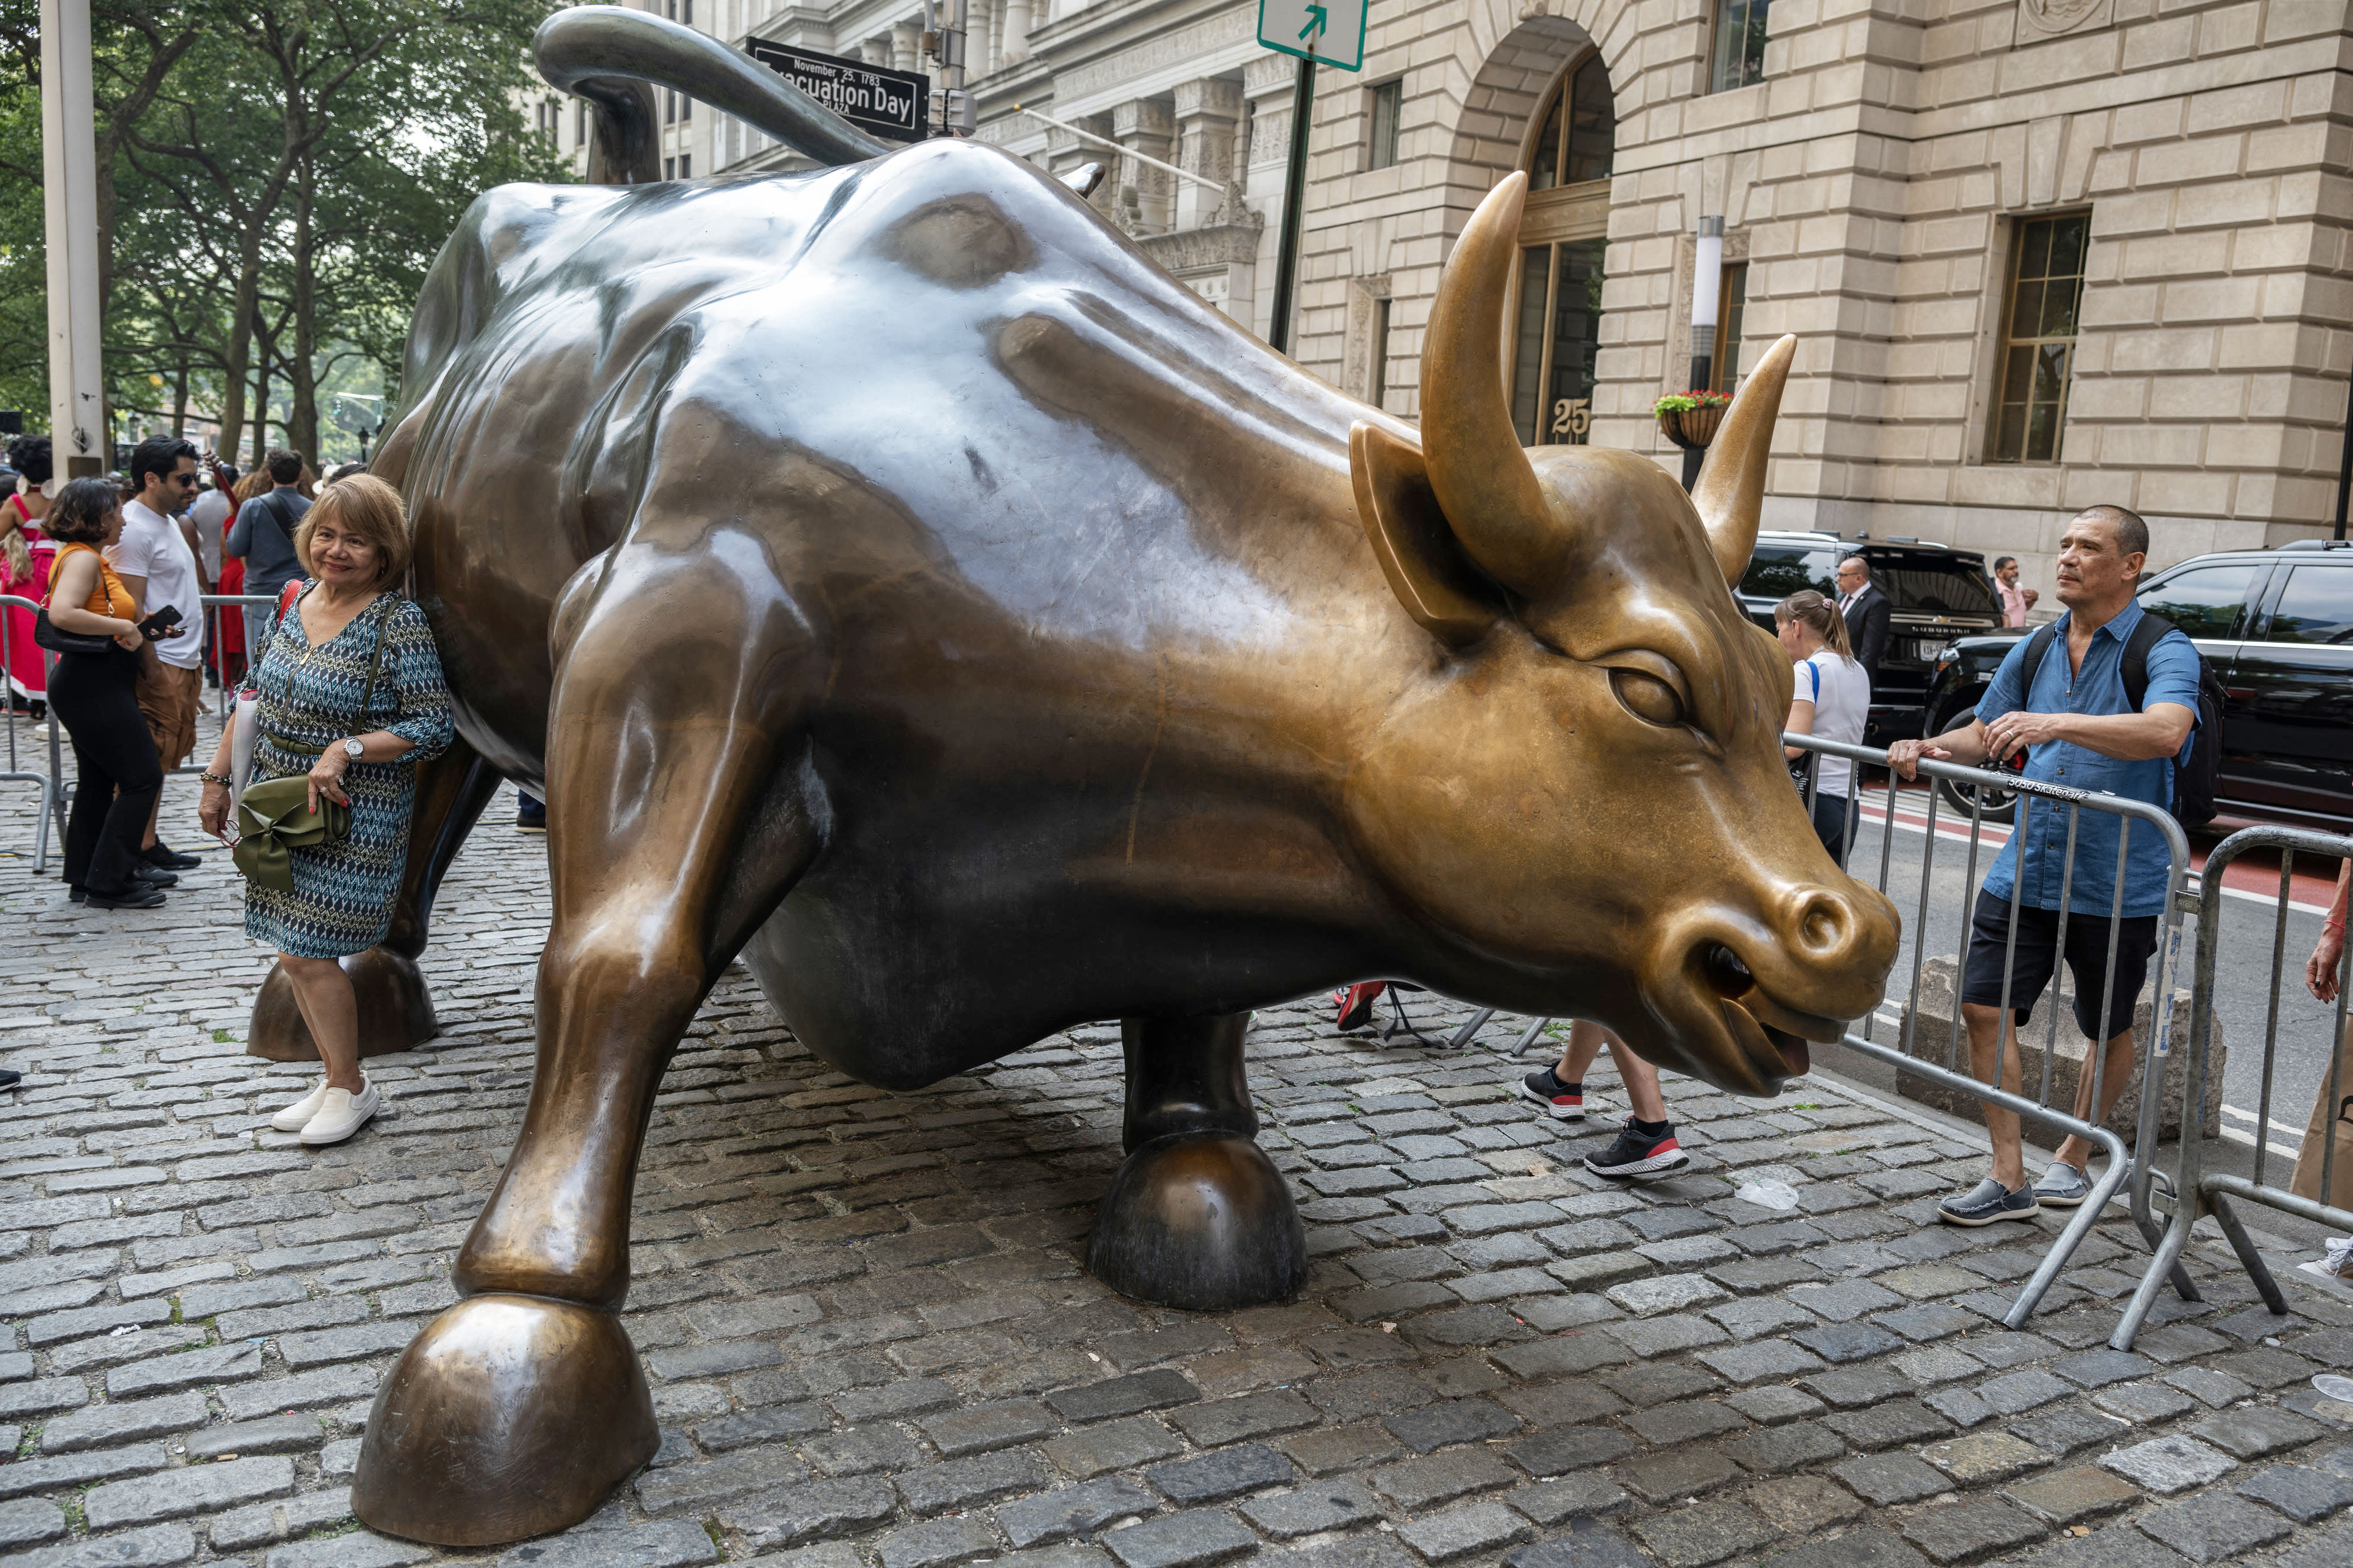
Visitors around the Charging Bull statue near the New York Stock Exchange, June 29, 2023.
Victor J. Blue | Bloomberg | Getty Images
November may be just what the Wall Street doctor ordered for our portfolio stocks after the notoriously tough month of October lived up to its reputation.