The 10 best January’s for stocks have two things in common — the full year ended with a gain and there was also a fairly significant sell off.
Strategas studied the 10 biggest January gains for the S&P 500 since 1950, and found the advances ranged from 5.8 percent, in 1980, to 13.2 percent, in 1987. If the S&P ends the month where it is now, it would be No. 6 of the top 10 with a 7 percent gain.
Each of those strong January performances led to a full year gain, averaging about 22.3 percent. Wall Street strategists, surveyed by CNBC, expect the S&P to rise to 3,000 by year end, from its current 2,860 level.
So in the top 10 January years, the old Wall Street adage — ‘so goes January, so goes the year’ worked well, but it left out the part about the correction.
In each of those years, there was a selloff ranging from a low 4 percent to as much as 34 percent — in 1987. The median loss in the intra-year selloffs was 8.2 percent, and the average correction was 11.8 percent.
After January, the S&P had a positive 11 months from Feb. 1 to Dec. 31, in all of the top years except for 1987. In 1987, the year of the crash, it lost 9.9 percent in that period and was up only 2 percent for the year. The other nine years averaged an 11-month gain of 13 percent.
“A strong January typically bodes well for the rest of the year, but we shouldn’t ignore the possibility of a correction. You typically see some form of a pull back, but the end result is a typically strong full-year performance,” said Todd Sohn, technical strategist at Strategas.
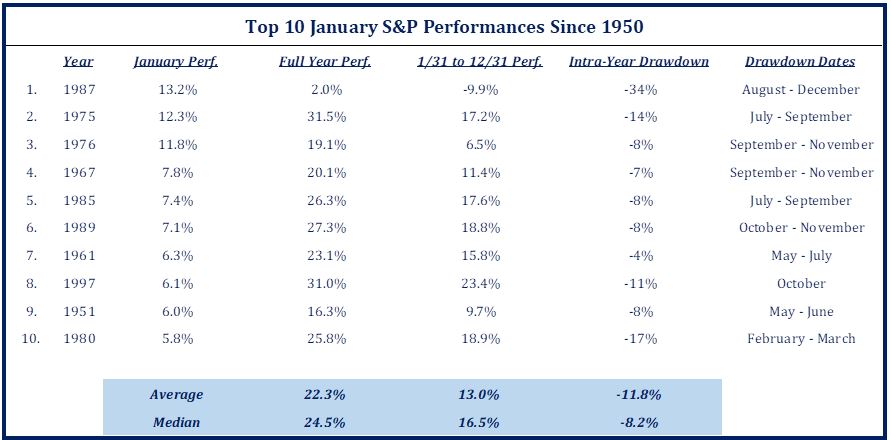
Source: Strategas Research