Stocks have proved plenty in the past two weeks. They sustained their first 3 percent dip in 15 months and the first 10 percent correction in two years then quickly regain their footing
The S&P 500 held crucial index levels such as the 200-day average and responded energetically to oversold conditions with a powerful bounce starting a week ago. The tape absorbed gusts of intense forced selling from funds trapped in doomed bets on volatility staying suppressed.
And investors have seemingly made a tentative peace with bond yields holding near four-year highs, with the 10-year note sitting just beneath 2.90 percent.
The S&P 500 has gained at least 1 percent in four of the past five sessions for the first time since it roared off the bottom of a deep correction in October 2011. In all, the index is up 7.8 percent from its lows and has recovered nearly six-tenths of the maximum loss from the Jan. 26 record high at 2872.
The rebound has been tenacious and impressive. Yet arguably the harder stretch of the recovery path could be ahead. Here are the next technical, fundamental and liquidity tests set out ahead of the market three weeks after its giddy melt-up rally ended and two weeks into a newly volatile search for equilibrium.
The S&P 500 has rallied right back up to a level that would be a logical place for it to stall, and perhaps even fall away into what many Wall Street purists still expect will be an eventual “re-test” of the recent lows.
The benchmark closed at 2731, right in a zone where the 50-day moving average, 10-day average, the break-even level for the year and the high from last Wednesday sit. As the chart shows, it nosed above the point of the failed recovery rally attempt nine days ago. Further gains from here would give weight to the argument that this is real-money buying coming back in rather than a mere bounce from oversold levels.

Larry McMillan, longtime trader and market strategist at McMillan Analysis, notes plenty of short-term buy signals have popped up. But the market still carries a burden of proof: “The S&P 500 chart is still one with lower highs and downtrending moving averages, and the put-call ratios have not rolled over to buy signals, either. It appears that a major test will take place somewhere in the 2740 to 2760 area, as this rally runs into the declining moving averages of importance.
“If the rally can continue on through there, that would improve the look of the chart tremendously. But for now, the intermediate-term is still in question.”
At the January peak, the market was stretched across all metrics: technically overbought, with investor bullishness and equity exposures sky high and valuations at the highest readings outside the Tech Bubble.
The correction relieved the overbought status and muted bullish sentiment. Valuations have indeed come down, with the forward P/E of the S&P 500 at 17.4, versus 18.3 three weeks ago.
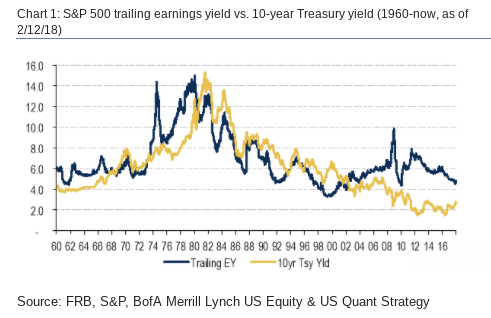
Yet in this entire market cycle, stocks’ earnings yield (the inverse of the P/E ratio) has only been lower relative to the 10-year Treasury yield for one month: January 2018. So even if stocks have come to terms with the 10-year near 3 percent, investors collectively haven’t yet demonstrated that they’re willing to bid aggressively for stocks when the valuation cushion compared to bonds is this thin.

As this long-term chart shows, stocks earnings’ yield used to be lower than the 10-year yield through past bull markets. But there is no fixed relationship in theory or practice here, and of course absolute bond yield levels have been at multi-decade lows. So the market still needs to prove in this cycle that it will accommodate a tighter valuation spread.
This could be the push-pull of the taper this year, as investors grapple with how much to pay for strong but perhaps close to peak earnings in a world of interest rates and inflation on the rise.
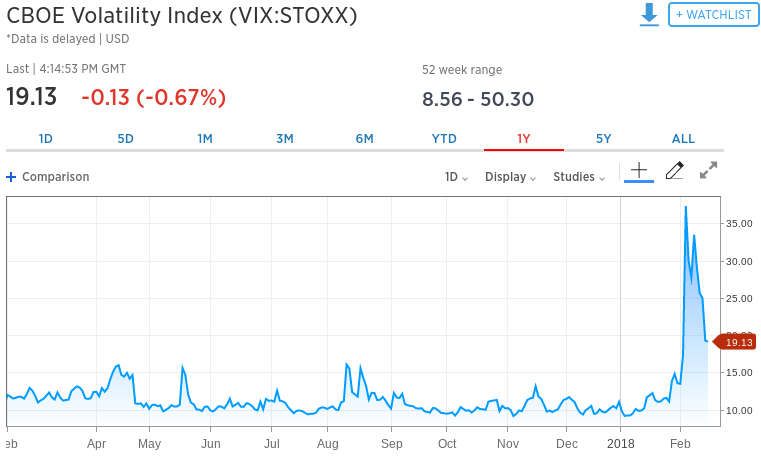
Finally, volatility expectations and the instruments linked to them should continue bleeding lower if a run back to the old highs on fuller valuations is to happen. The Cboe S&P 500 Volatility Index (VIX) has been moving in the right direction in recent days after the volatility shock triggered forced buying of VIX futures by unraveling bets against volatility.
Still, a VIX above 19 is still a bit sticky at elevated levels given the market’s five-day surge. This isn’t too unusual; after a volatility storm the VIX tends to stay inflated. And this time the purge of so many traders who sold VIX products short might be holding the VIX aloft for now.

No matter the cause, bulls should want the VIX to keep retreating toward or even below 15 in coming days and weeks to signal the equity market’s unstable weather system has passed and give professional investors more confidence to add risk to their portfolios.

