The market could be due for a correction now that the S&P 500 is trading above the 3,000 level, according to the charts.
Because of this, there is good reason for investors to be more cautious about their portfolio, CNBC’s Jim Cramer said Tuesday citing technician Carley Garner. The S&P has added more than 650 points, almost a 28% run, since its December lows that came during the market-wide meltdown in the fourth quarter.
“After the epic run in the averages, the charts, as interpreted by Carley Garner, suggest that the upside in the stock market has gotten more limited,” said the “Mad Money” host.
Garner, Cramer explained after perusing her conclusions, thinks much of the positive sentiment about things such as a potential interest rate cut, the economy and trade talks with China has been baked into the market. In February, the DeCarley Trading co-founder said that optimism would peak if the broad index reached these levels.
“Ever since the meltdown late last year … Garner’s been bullish on the stock market — that’s one of the reasons why I like her — she’s been dead right, but all along she has been using 3,000 as her target for the S&P,” Cramer said.
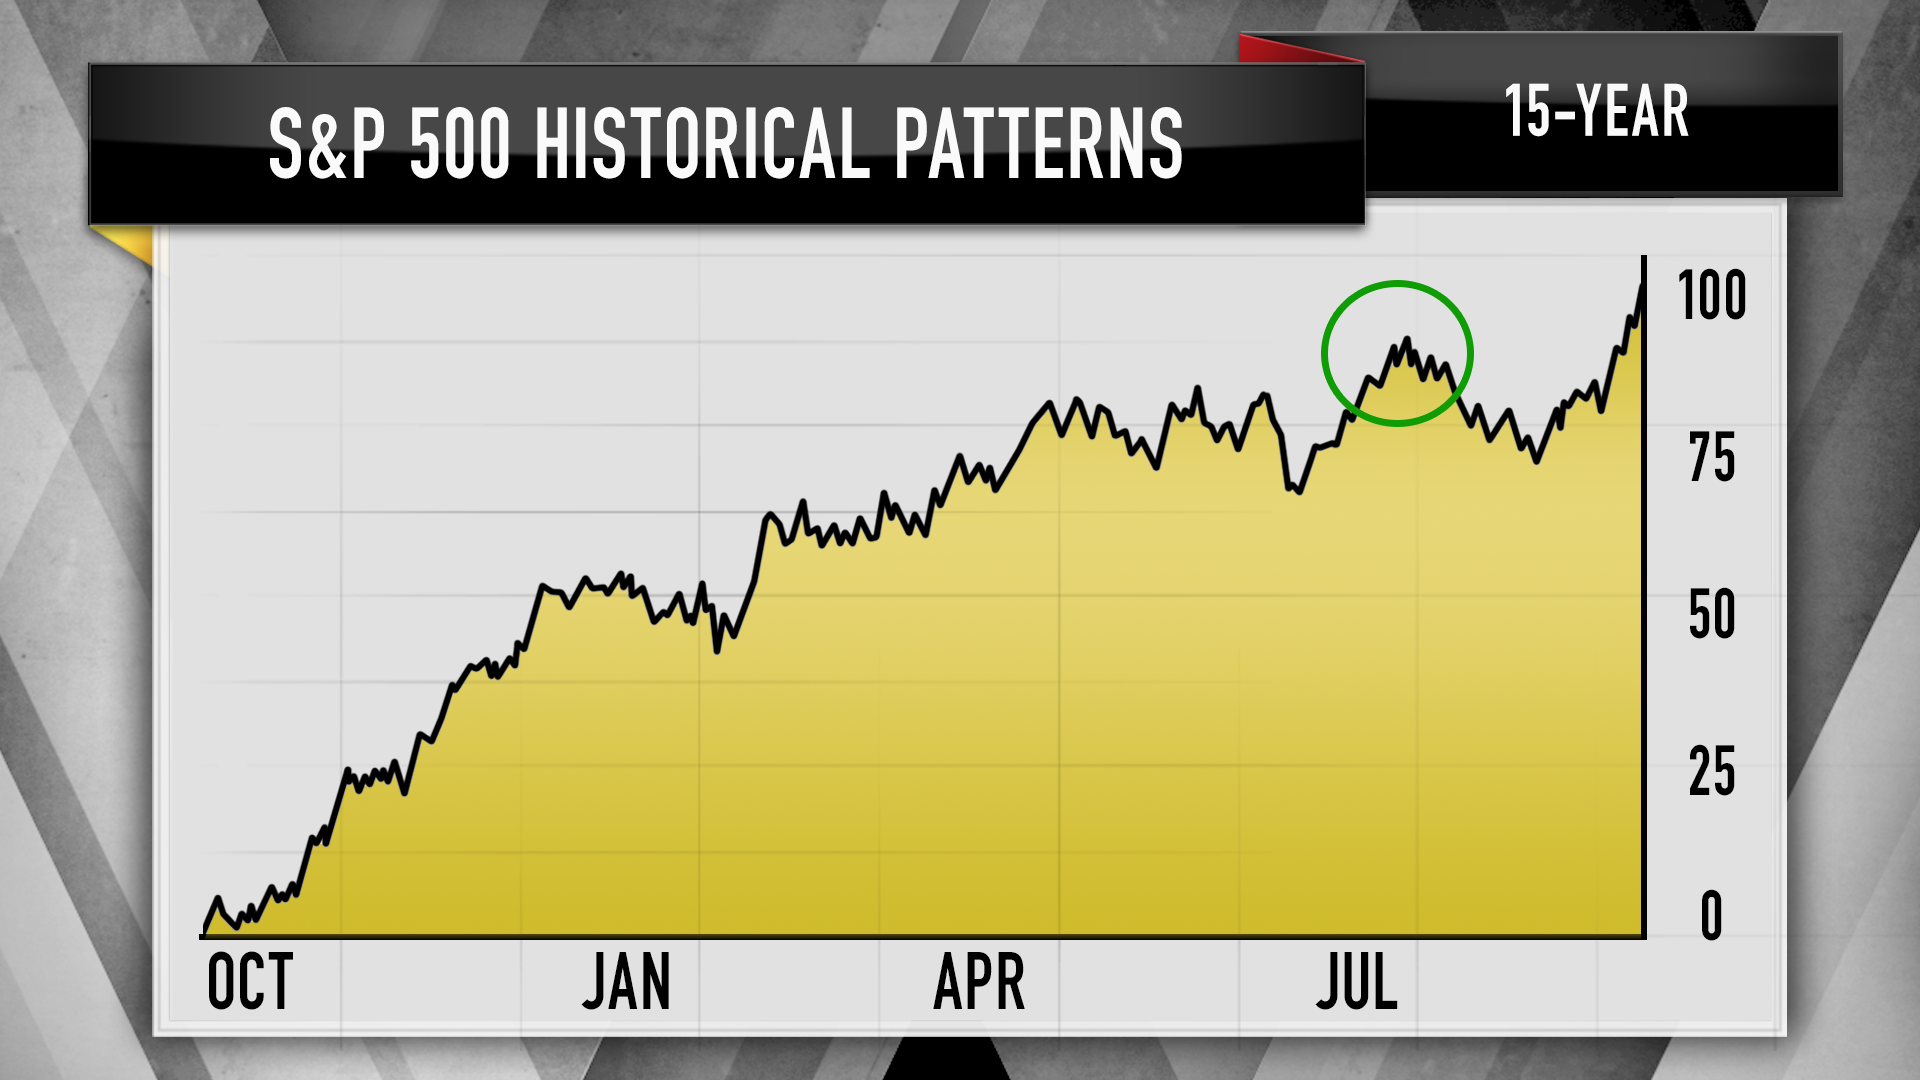
One thing that Garner bases her argument on is the correlation between seasonal trends in the S&P 500 and market sentiment. The technician highlighted that the S&P over the past 15 years has often peaked in July and fallen through late August, Cramer said.
On top of that, Garner says the Consensus Bullish Index shows that most industry insiders are optimistic about the market and the CNN Fear & Greed Index indicates investors are in greedy territory, although it’s “less greedy than we’ve seen in previous rallies,” Cramer said.

“People like this market, which is not what we want to see,” he said. “You could argue this means that the market has more upside, but Garner’s more concerned … that the fear and greed index has been making lower highs and lower lows, which suggests that the potential upside here is probably limited, at least for the time being.”
Looking at the E-mini S&P 500 futures, which sets prices for buyers and sellers to trade an asset, Garner sees a ceiling of resistance between 3,035 to 3,060, the host said. The lower end leaves about 30 points of more upside from the session’s 3,004 close.
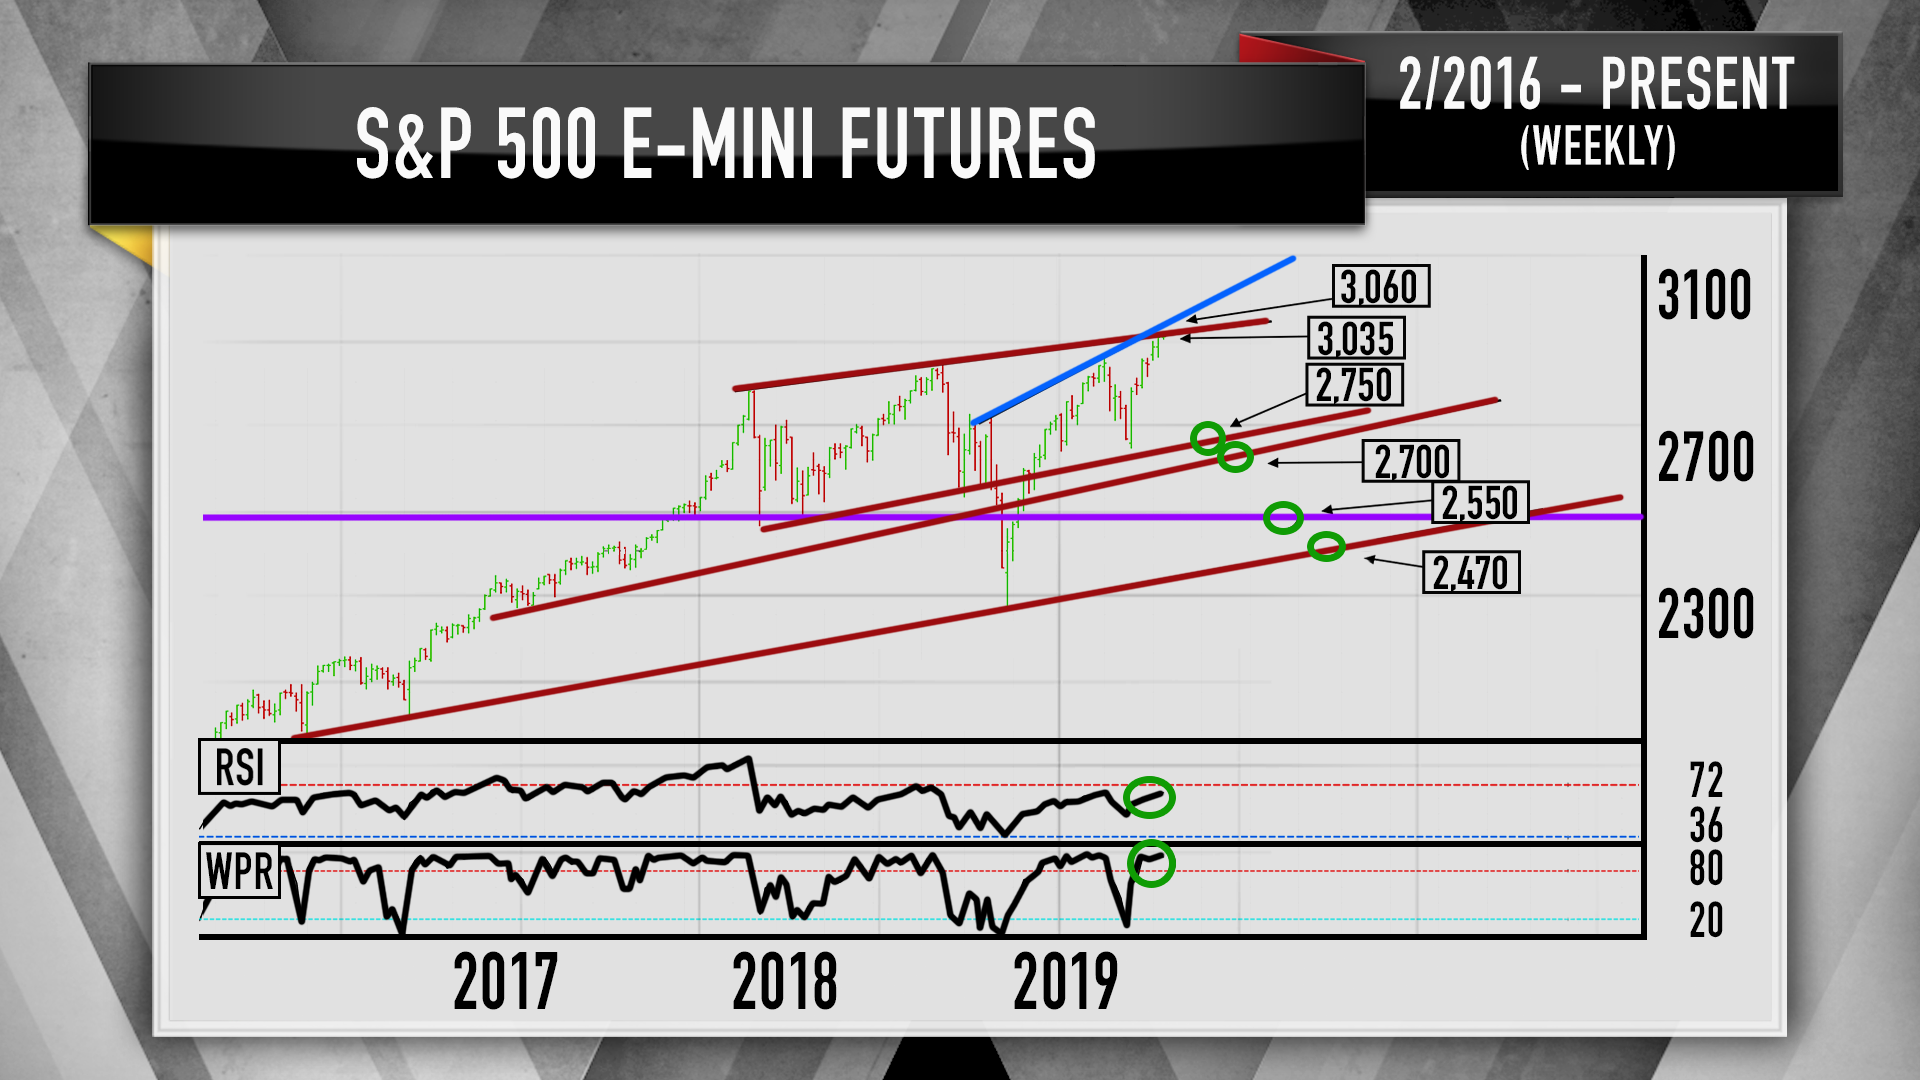
Furthermore, the relative strength index (RSI), a momentum measurement, is nearing the overbought threshold of 70 and the Williams %R oscillator, another momentum indicator, is already in extreme overbought territory at 99, Cramer said.
“This suggests the S&P has come up too far, too fast. When both of these oscillators are at extreme highs, you often see the same pattern: the buying starts to dry up and a correction, there’s the keyword, begins,” he said.
If Garner’s predictions prove true, she says the S&P 500 could drop to the low 2,700s and, in the worse case, as far as 2,470, Cramer said.
“It’s possible she’s being too cautious, but her general point is correct though: the risk reward up here, it’s simply not as good [as it was] a month or two ago,” he said.